A few decades ago, only mining companies and governments could afford satellite images. Today, several missions publish their data free of charge, and anyone can study a terrain before walking on it. Used well, satellite images save days of fieldwork by showing where to look first.
What a satellite actually measures
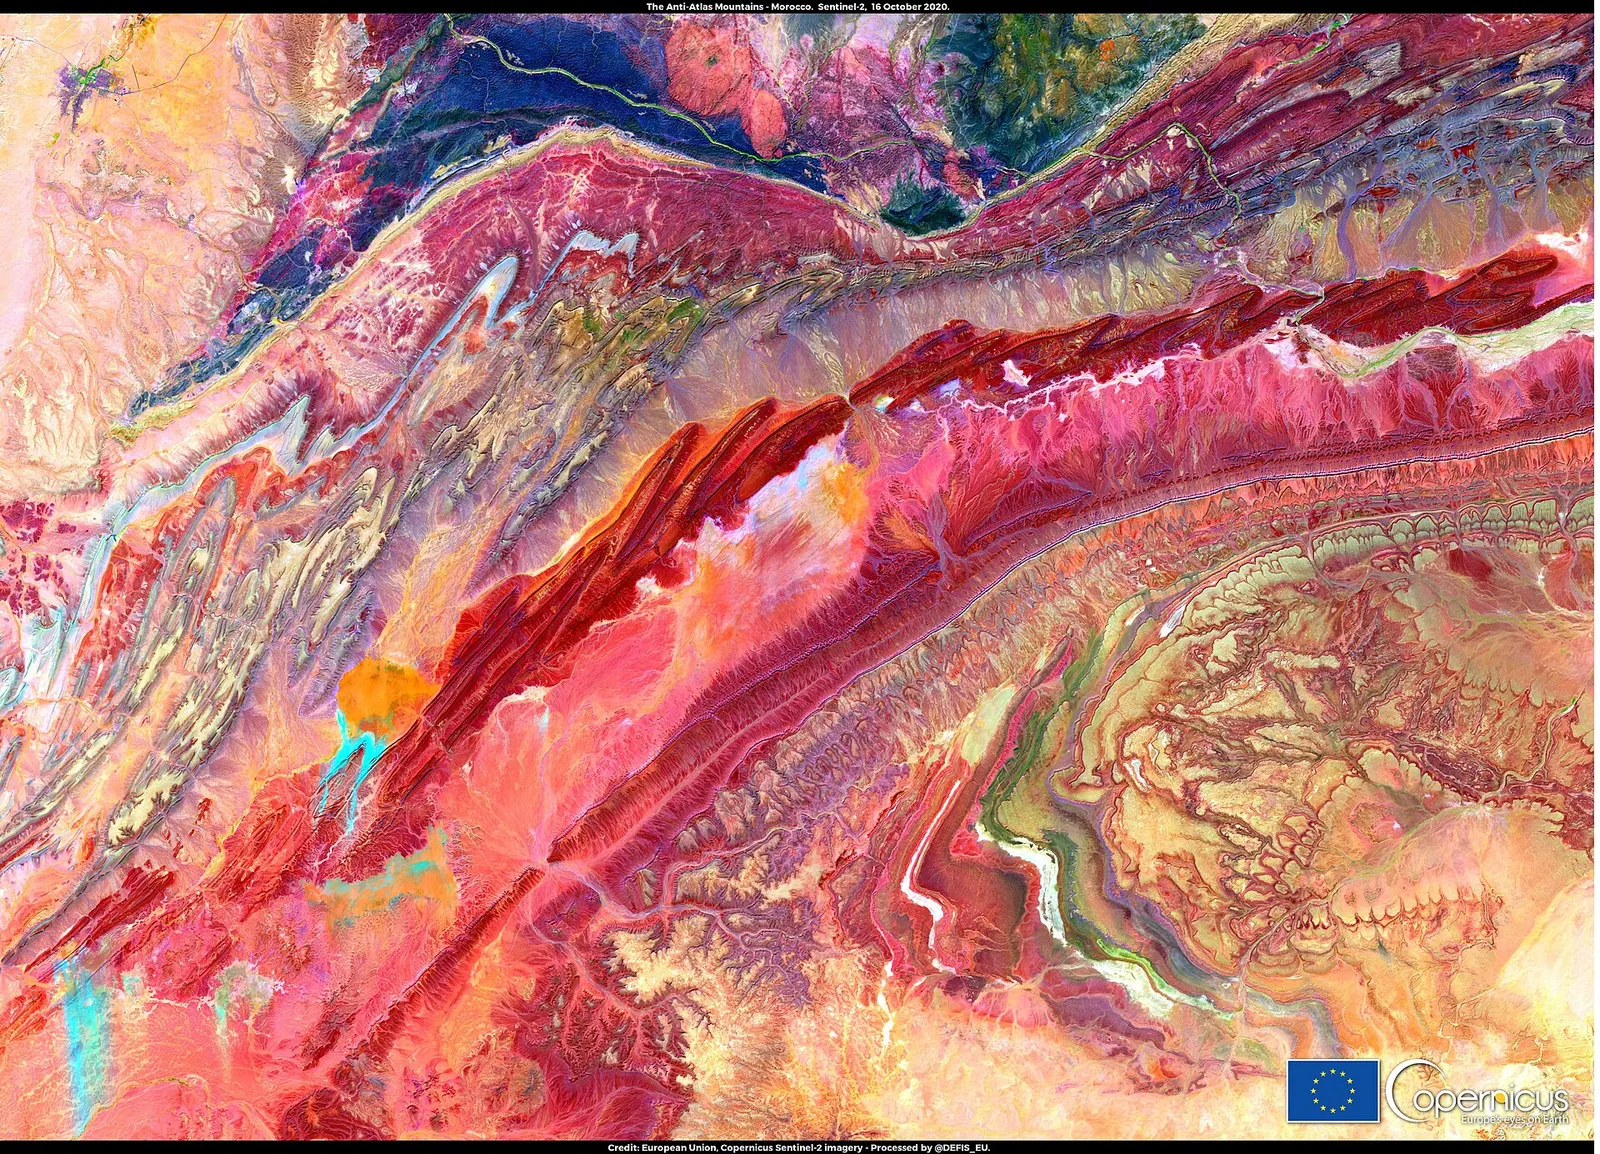
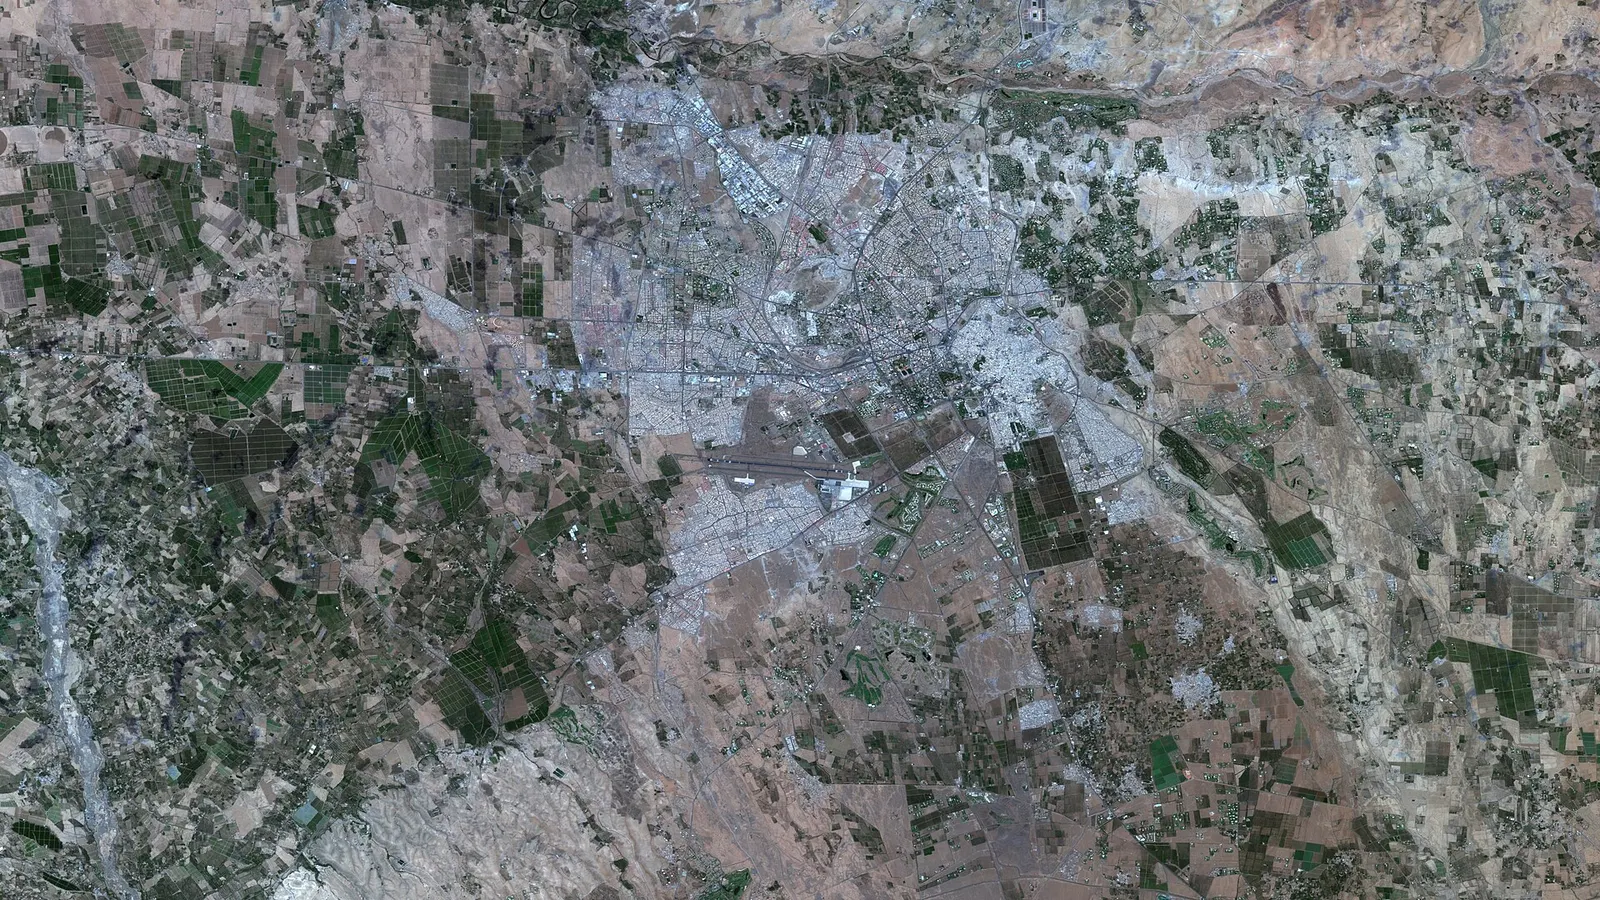
Optical satellites record the sunlight reflected by the surface in several spectral bands, some visible to the eye and others in the infrared. Every material, rock, soil, vegetation and water, reflects these bands differently. Combining bands produces images in which geological differences stand out much more than in a normal photo.
Radar satellites work differently: they send their own microwave signal and measure the echo, day and night, through clouds.
The main free missions
| Mission | Type | Resolution | Useful for |
|---|---|---|---|
| Sentinel-2 (ESA/Copernicus) | Optical, 13 bands | 10 to 60 m | Rock and soil mapping, vegetation, recent images every few days |
| Landsat 8 and 9 (NASA/USGS) | Optical and thermal | 15 to 100 m | Geological mapping, long archive since the 1970s |
| ASTER (NASA/Japan) | Optical and thermal | 15 to 90 m | Mineral mapping; its short-wave infrared data date from before 2008 |
| Sentinel-1 (ESA/Copernicus) | C-band radar | about 10 to 20 m | Moisture, surface roughness, ground movement, all weather |
| Copernicus DEM, SRTM | Elevation | about 30 m | Relief, drainage, faults |
What the images can reveal
Rock types and structures
False-colour combinations separate granite, schist, limestone and volcanic rocks. Lineaments, long straight features, often follow faults and fractures: the pathways of mineralising fluids and of groundwater.
Alteration and iron oxides
Hydrothermal fluids alter rocks around deposits, producing clays and iron oxides. These minerals absorb specific wavelengths, so band ratios can map them. A common example is the ratio of red to blue for iron oxides, and ratios in the short-wave infrared for clays. Our article on gold geology in Morocco explains why these zones matter.
Moisture and vegetation
Vegetation indices and radar images show where the ground stays wetter or where plants remain green in the dry season. That can point to shallow groundwater or to a fault. See how to find groundwater.
Relief and drainage
Elevation models show valleys, terraces and the network of wadis: useful to understand where placer gold or water accumulates.
What satellites cannot do
- They do not see objects underground. Optical images show the surface only. Radar can penetrate a little into very dry sand, but not metres of ordinary soil.
- They do not identify gold. They map minerals and structures that are associated with deposits, which is a probability, not a certainty.
- Resolution limits detail. A 10 m pixel cannot show a small object or a narrow vein.
Any serious interpretation therefore ends with a field visit, measurements and, where allowed, sampling.
How we use satellite data
Our satellite study service combines several of these layers for a site you choose: radar, multispectral images, thermal data and elevation. The result is a set of maps with priority zones to check on the ground with the right device, and a written explanation of what each layer shows. On the same page you can also follow Earth-observation satellites live on a 3D globe.
Getting started yourself
- Open a free viewer such as the Copernicus Browser or the USGS EarthExplorer.
- Search for your area and pick a recent, cloud-free Sentinel-2 image.
- Compare natural colour with a false-colour or geology preset.
- Mark lineaments, colour changes and green lines, then plan a field visit.
Summary
Free satellite data turn a blank map into a list of places worth visiting. They show rocks, alteration, moisture and relief over large areas, but they do not see buried objects. Use them to choose where to go; let fieldwork decide what is there.