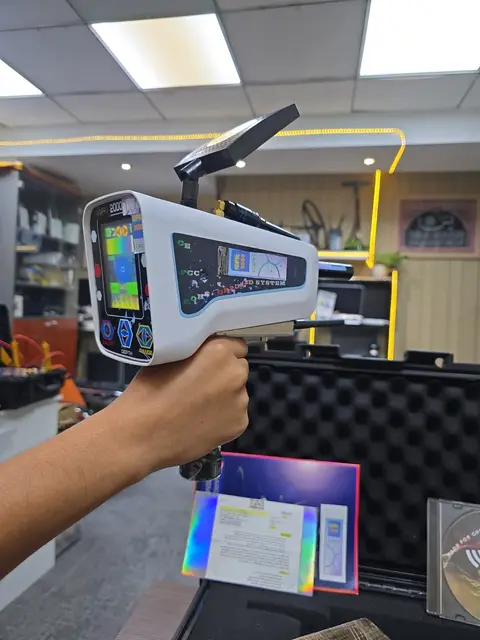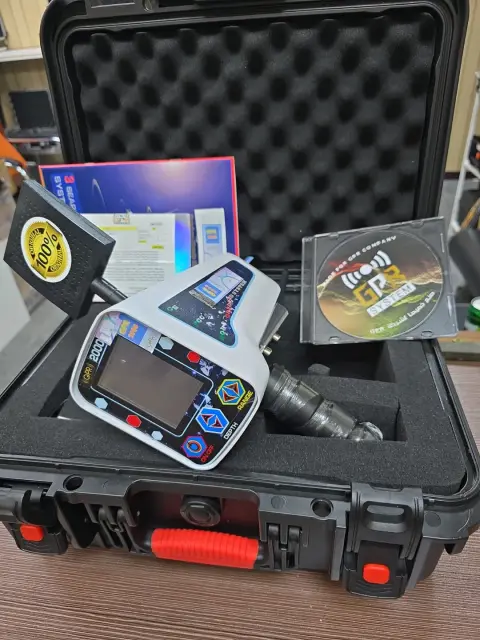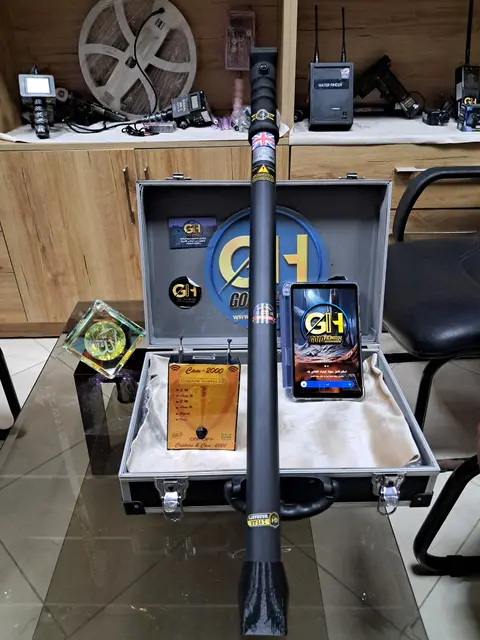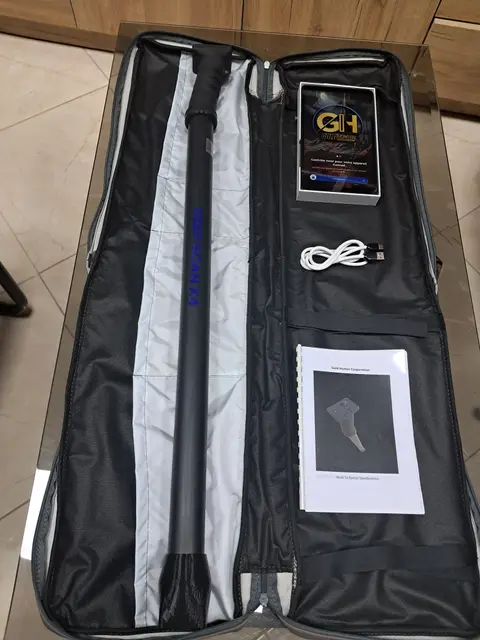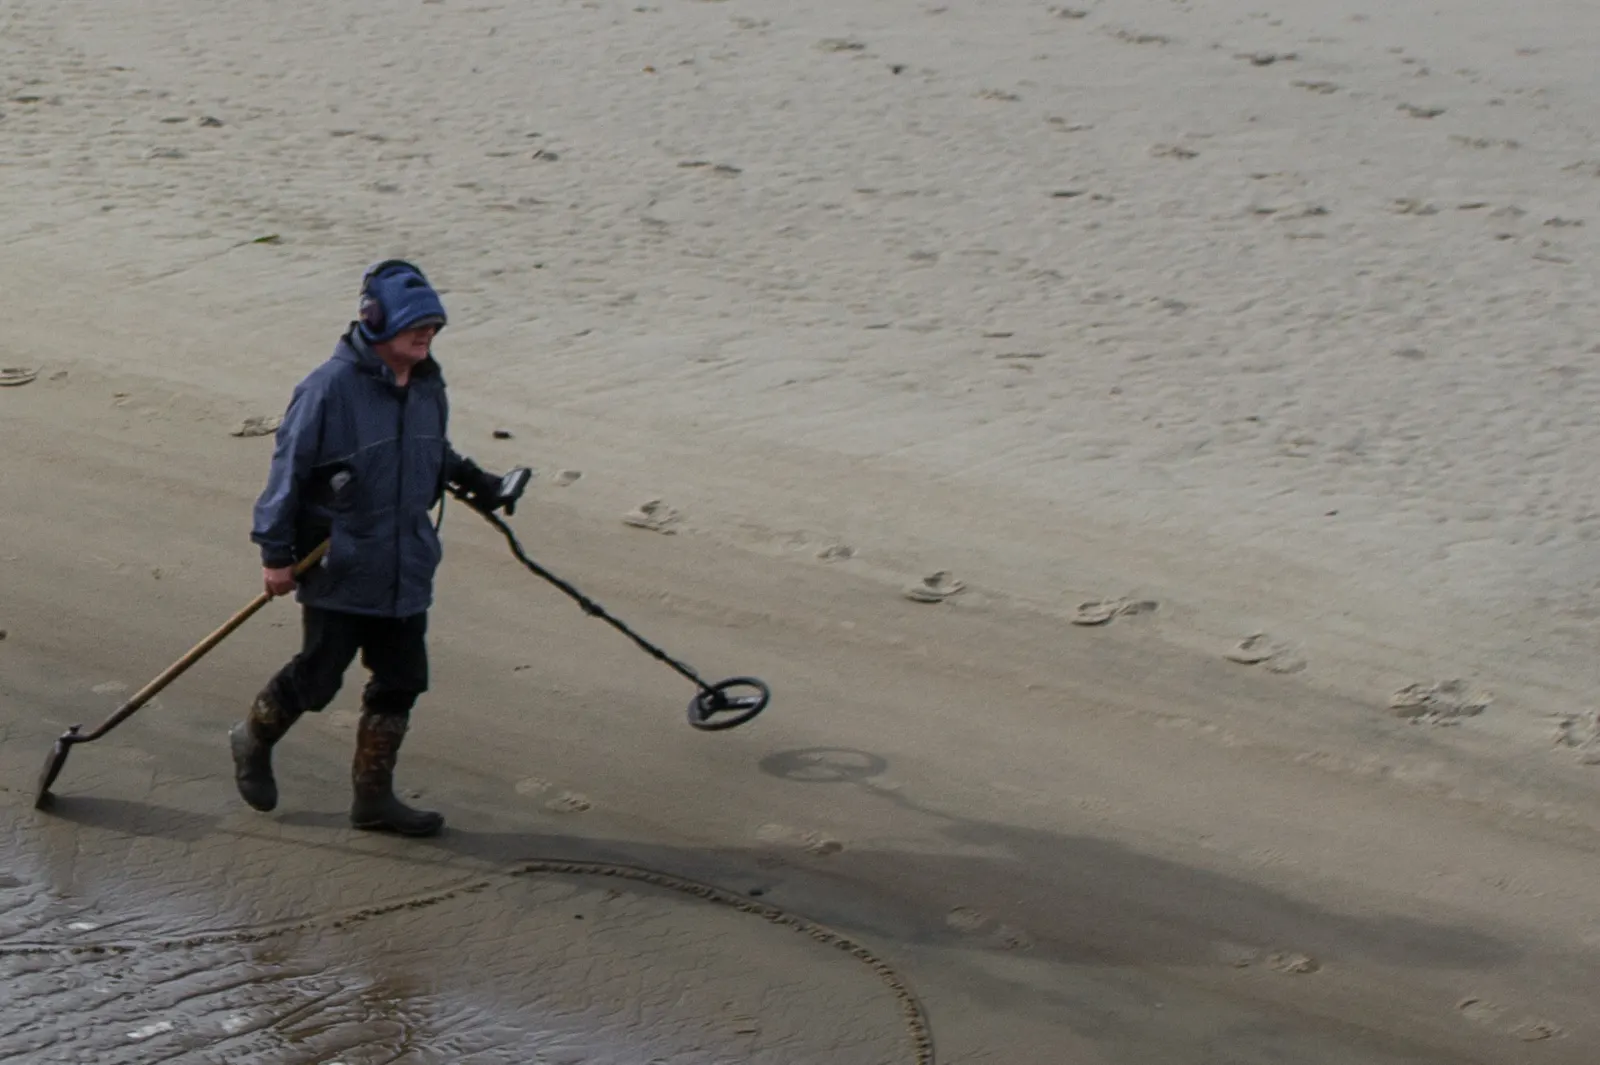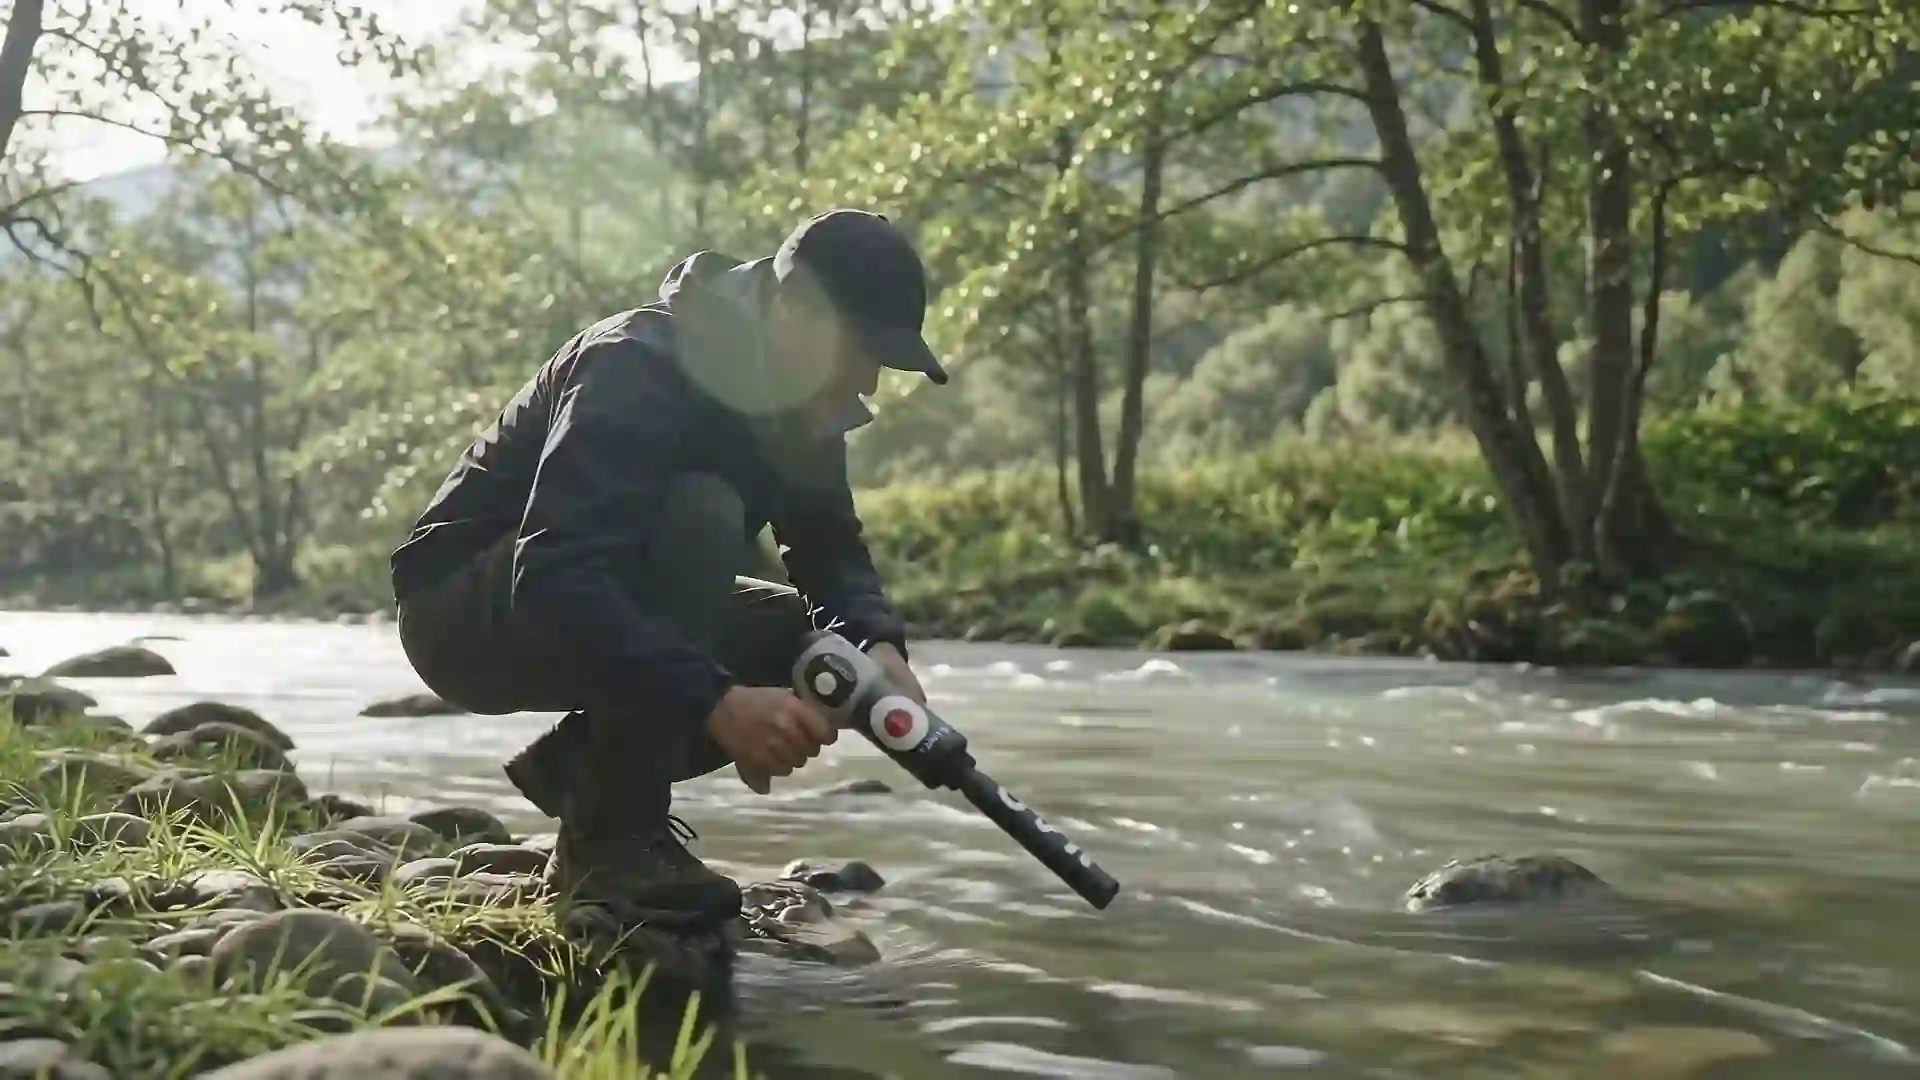
A metal detector tells you that something metallic is below the coil. Ground-imaging devices try to go further: to show layers, cavities and large objects in the ground, sometimes in three dimensions. This article explains how they work and how to read their results without illusions.
How ground-penetrating radar works
Ground-penetrating radar (GPR) sends very short pulses of radio waves into the ground through an antenna. When the waves meet a boundary between two materials with different electrical properties, for example dry sand and wet clay, rock and air in a cavity, or soil and a metal pipe, part of the energy is reflected back to the surface.
The device measures the time each reflection takes to return. Knowing, or estimating, the speed of the waves in that soil, it converts time into depth.
Frequency, depth and resolution
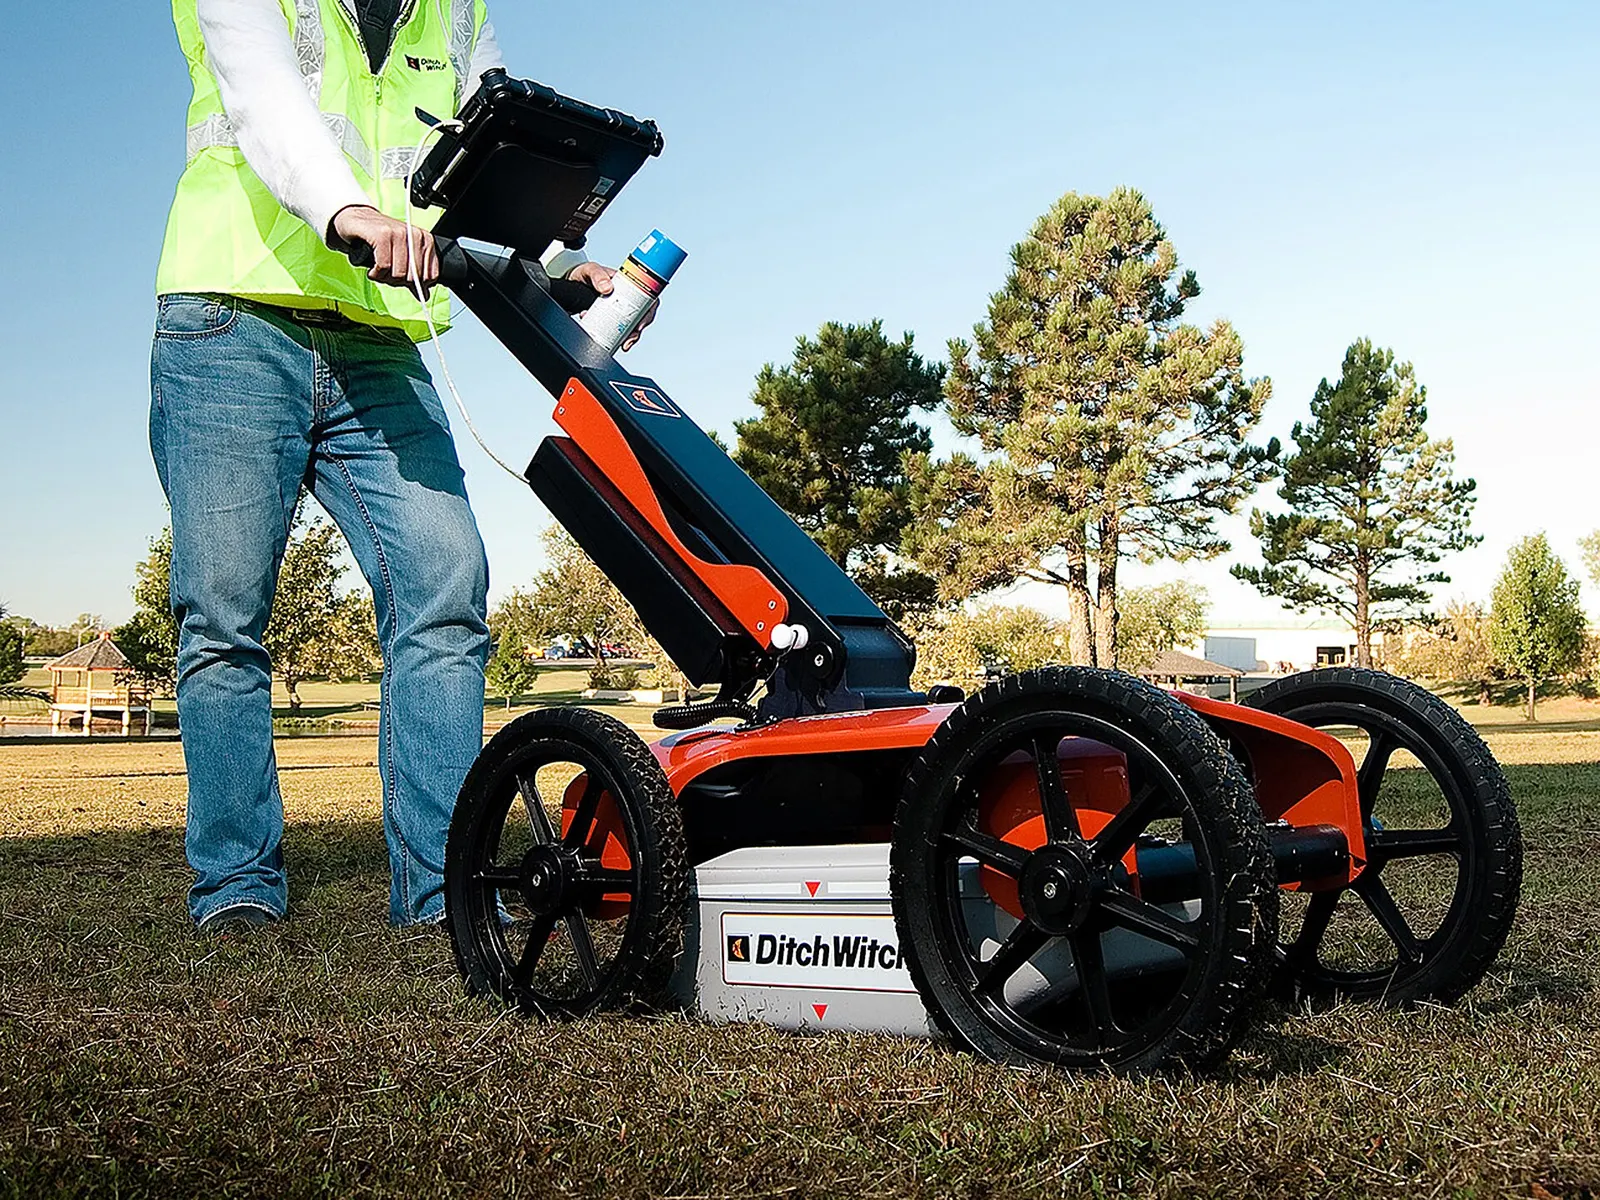
The antenna frequency sets the balance between depth and detail:
| Antenna frequency | Typical use | Depth | Detail |
|---|---|---|---|
| Low (tens to around 250 MHz) | Geology, deep layers, large voids | Deeper | Coarse |
| Medium (around 250 to 600 MHz) | Archaeology, utilities, general survey | Medium | Good |
| High (above 1 GHz) | Concrete, very shallow targets | Shallow | Very fine |
The soil matters even more than the antenna. Dry sand, gravel and many rocks let radar waves travel far. Wet clay and salty soil absorb them quickly; in those conditions, penetration may drop to well under a metre whatever the device.
Reading a radargram
A GPR survey line produces a radargram: a vertical slice of the ground, with distance along the line horizontally and time or depth vertically.
- Horizontal bands are layers: a change of soil, the water table, bedrock.
- Hyperbolas, upside-down U shapes, are produced by compact objects such as a stone, a pipe or a metal object. The top of the hyperbola marks the object.
- Strong, flat, bright reflections with ringing below them can indicate a cavity or a metal surface.
Interpretation takes practice. A tree root, a rock or a change of moisture can produce strong reflections too.
How 3D images are made
A 3D image is not a photograph of the ground. It is a model built from many measurements:
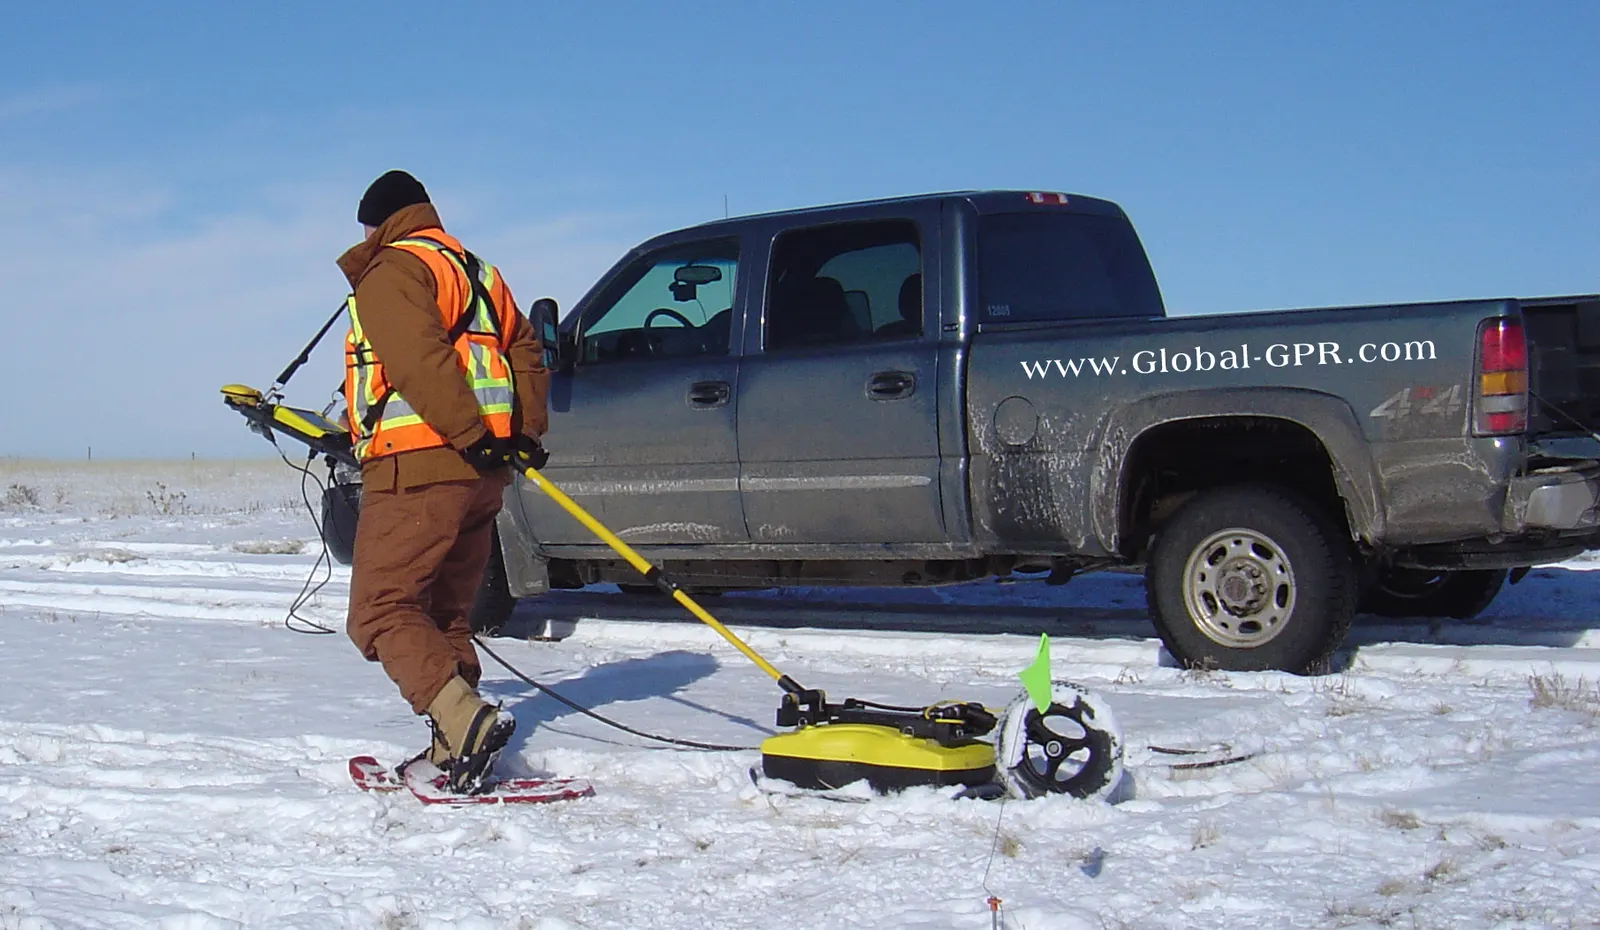
- The operator walks parallel lines across the area, often 25 to 50 cm apart, sometimes in both directions.
- Each line gives a slice; software aligns the slices on a grid.
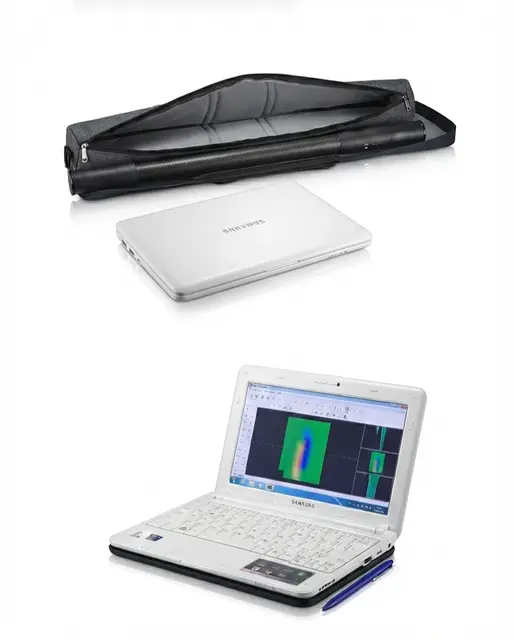
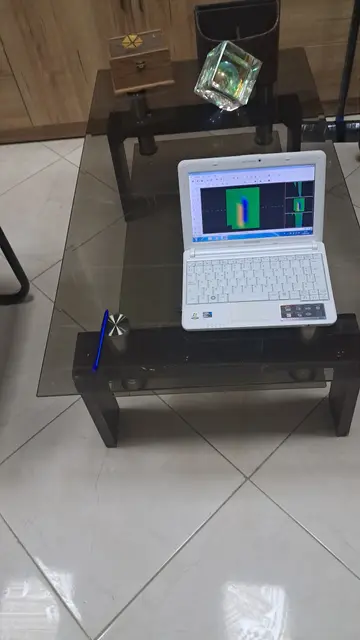
- The software interpolates between them and displays depth slices or a 3D volume in colour.
The quality of the image depends directly on the discipline of the grid. Lines too far apart, a crooked path or a grid that is too small produce images that look impressive but mean little.
Other 3D ground scanners
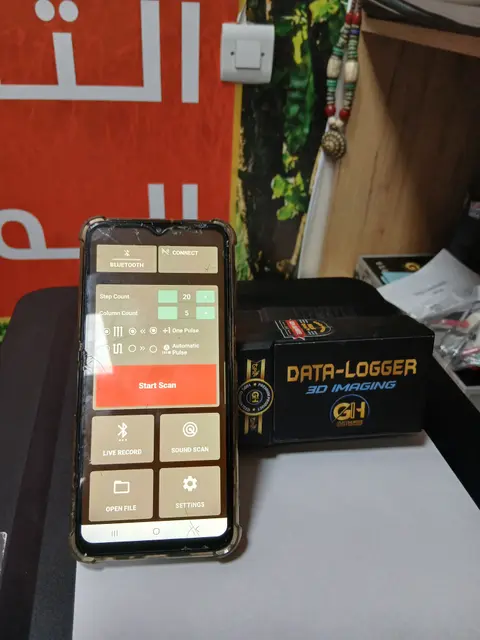
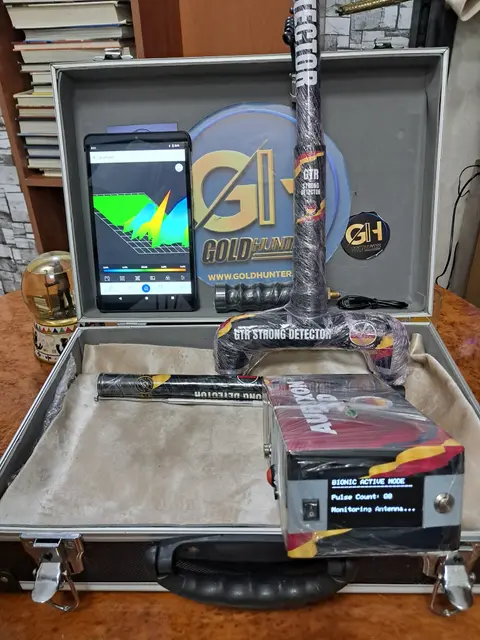
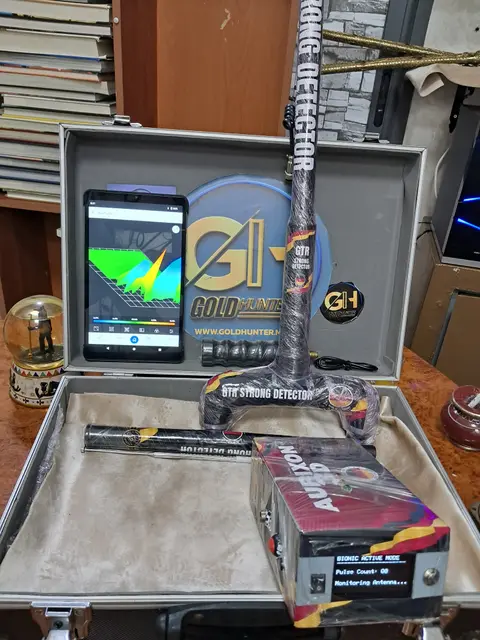
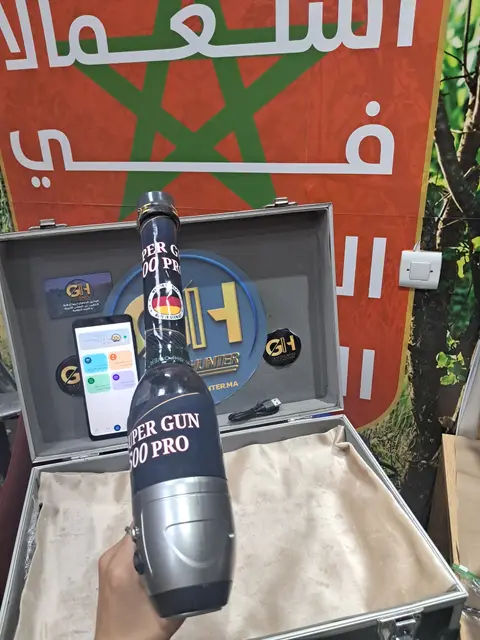
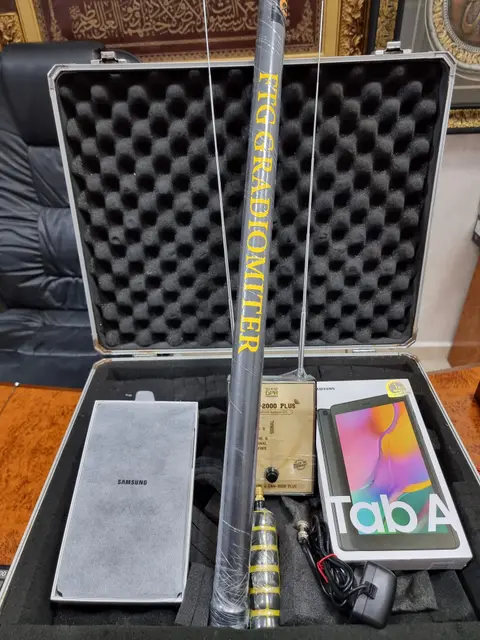
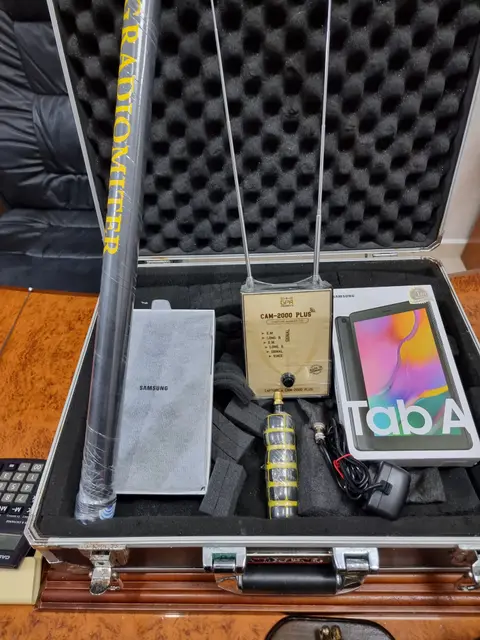
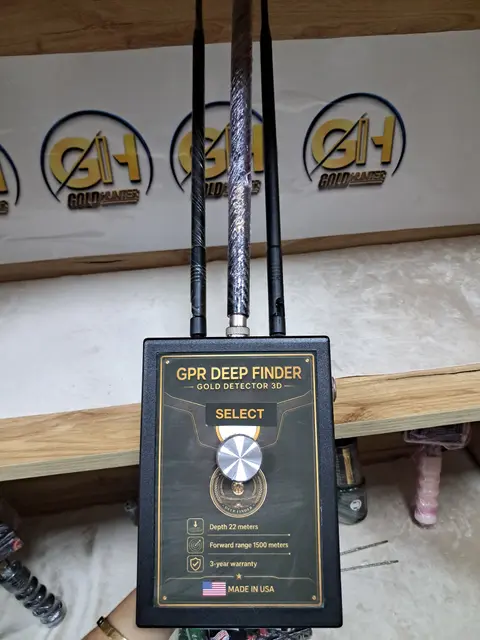
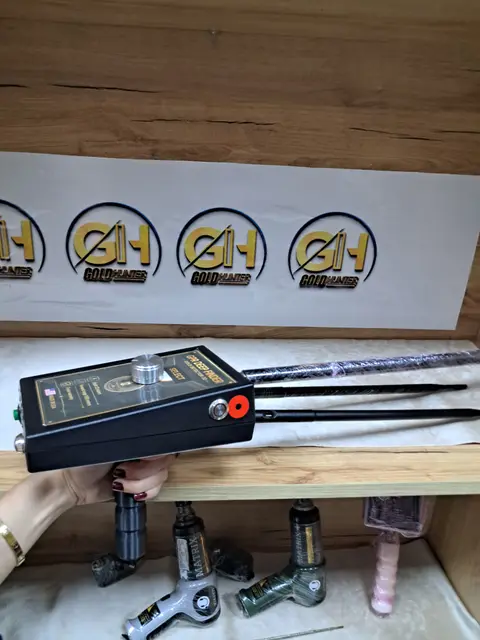
Not every device that shows a 3D image is a radar. Many ground scanners used by prospectors record magnetic or electromagnetic measurements point by point along a grid and display them as a coloured 3D map. They can show metallic objects and some ground disturbances clearly, but they measure a different property from GPR and have their own limits. Ask what the sensor actually measures, and at what depth it is reliable for an object of the size you are looking for.
Good practice on site
- Test the ground first over a known object or a known feature to see how deep the signal goes.
- Survey a larger area than you think you need, so that the target stands out against normal ground.
- Record the grid position with stakes and a tape, or with GPS.
- Scan twice, in perpendicular directions, before drawing conclusions.
- Confirm any anomaly with a second method: a metal detector, a probe or a small test pit where it is lawful.
Summary
Ground imaging is powerful when the soil allows it and the survey is methodical. It shows contrasts, not labels: it does not say “gold” or “treasure”, it shows where the ground is different. Used with patience and cross-checked, it saves a great deal of digging. Browse our 3D imaging devices or ask us which system suits your ground.